
status.arc42.org arc42 section 6
Runtime View
This chapter was still an empty template in the original documentation; the scenarios below are assembled from the sequence and activity diagrams and the architecture decisions that describe them.
Serving the statistics table
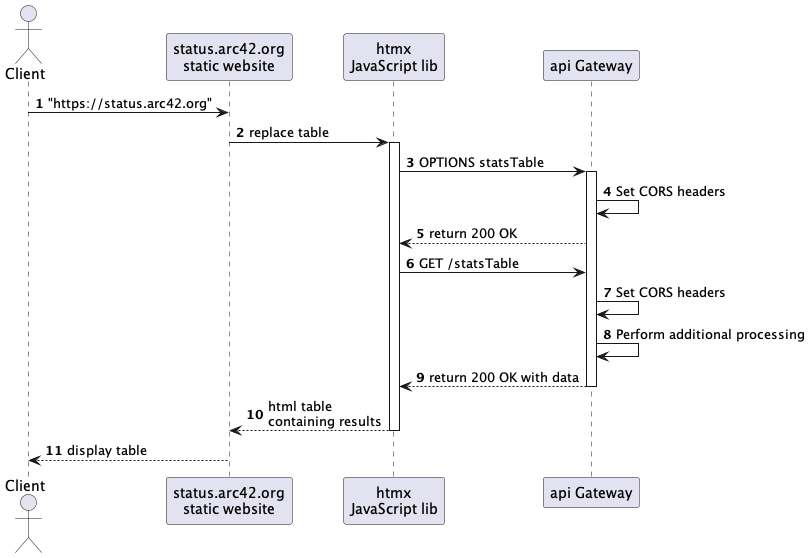
- A client opens
https://status.arc42.org, which loads the static Jekyll site. - The page’s
htmxJavaScript replaces the (empty) table placeholder with a request for live data. htmxissues a CORS preflight (OPTIONS /statsTable) against the api gateway, which is on a different origin — the Fly.io app, not GitHub Pages.- The gateway sets CORS headers and returns
200 OK. htmxissues the real request,GET /statsTable.- The gateway sets CORS headers again, performs the actual processing, and
returns
200 OKwith the data. htmxswaps the returned HTML table into the page; the client sees the result.
Concurrent collection of statistics
Each request for site statistics fans out into a set of concurrent API
calls, one goroutine per external call, coordinated with a sync.WaitGroup
and no mutex:
domainiterates over all monitored sites.- For each site, two branches run in parallel:
siteStats.GetSiteStatisticsfans out further into three parallel calls to Plausible.io — one each for the 7-day, 30-day and 12-month windows.repoStats.GetRepoStatisticscalls the GitHub GraphQL API once for the same site.
domainaggregates the results per site once all branches for that site return.
Doing this sequentially for the 7+ monitored sites — three Plausible calls and one GitHub call each — took roughly four seconds on average; running the calls concurrently was the direct fix.
System startup
- The process initialises its logger, database connection, and cache.
- It loads site statistics once, caching them with a 10-minute expiry.
- It loads repository statistics once, caching them with a 1-minute expiry.
- The API server starts and detaches to keep serving requests, waiting for incoming HTTP requests.
- On an external event (such as a probe run) it performs the corresponding processing before returning to waiting.
Startup time itself is written to a system_startup table, which is how the
operator can tell, after the fact, when Fly.io suspended and restarted the
machine.
Availability probe run
Triggered externally every 15 minutes by cron-job.org:
cron-job.orgcallsPOST /api/probewith a bearer token.- The call itself wakes and warms the Fly.io machine — a side effect that eliminates cold starts for the next human visitor.
internal/proberequests each monitored site with a 10-second timeout and checks status code, latency, and expected content.- A failing check is retried; a site is only marked
downafter 2 of 3 attempts, five seconds apart, fail. - Results are written to Turso: a
status_snapshotrow only on a state change, an upsert into the day’sstatus_bucket, and always oneprobe_runheartbeat row. - If a site is
down, a Slack notification is sent. - The process returns
200 OKand exits — the prober is a batch job, not a long-running service.